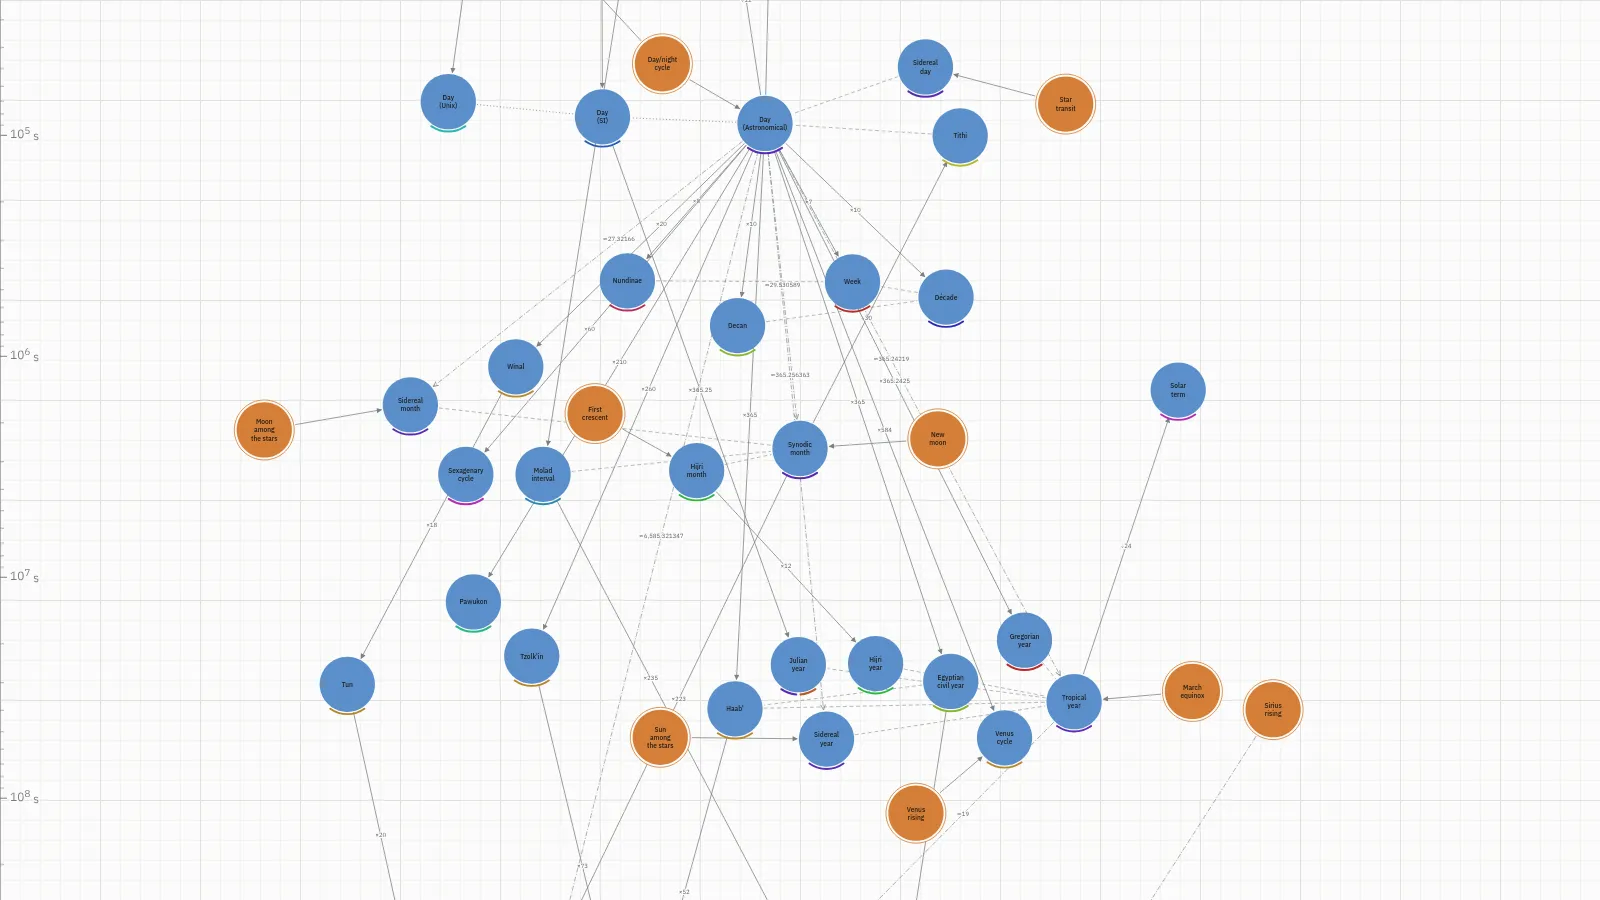
Open the graph in a new window
The idea
While there are many units of time in use across cultures and history, the natural sources for them are relatively few. I wanted to explore the following concepts:
- What are the various “root” sources of time units?
- What scales do time units tend to cluster around throughout cultures and history? i.e. what scales of time do people tend to find meaningful to refer to often?
- What units of time break from the above and why? For example, a week is 7 days despite there being no observed phenomena at 7 day scales.
Reading it
Filled circles are units. Ringed circles are sources: things you watch happen, like the day/night cycle, a new moon or a caesium atom’s transition. In “Length mode”, Depth is length, shorter above longer on a log scale, so units of a similar length line up whether or not they are intentionally linked. NOTE: Where a long stretch of lengths is empty it is drawn shorter, and the scale on the left edge marks the break.
Lines/arrows are relations:
- A solid arrow is a definition: e.g. a week is defined by being 7 days.
- A dash-dot line is a relation rather than a definition, so a synodic month is roughly 29.53 days, because it is defined not by days but by the lunar cycle.